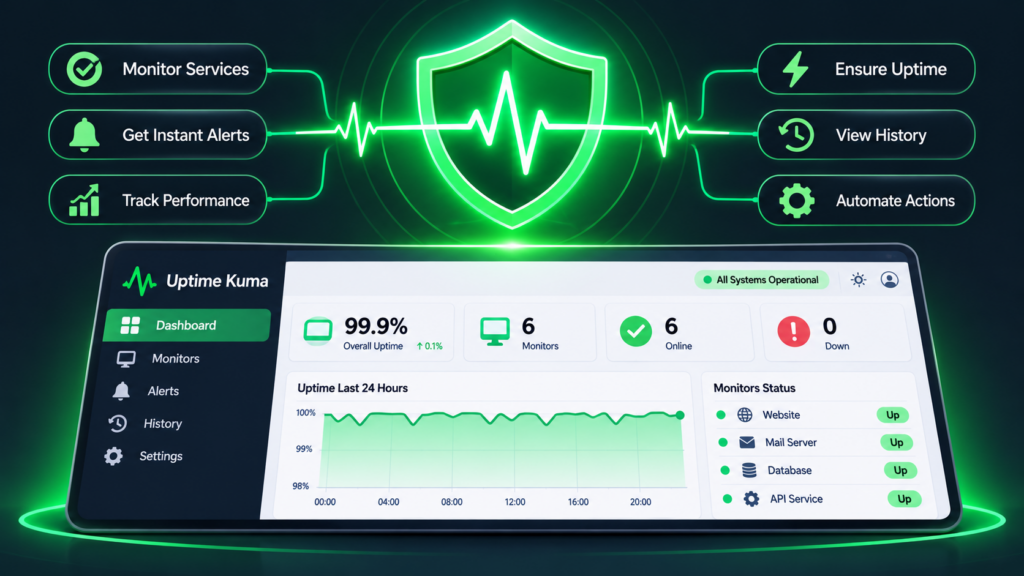
Uptime Kuma is the best self-hosted monitoring tool available — and the most misconfigured one. Install it with default settings and you get a green dashboard that confidently tells you everything is fine while your site is down, your mail queue is 40 minutes deep and your certificate expired three days ago.
Monitoring is the layer that decides whether you find out about an outage from a client email or from your phone. Here is how to make Kuma actually earn its place in a self-hosted stack.
- What Kuma is and what it is not
- Installing it properly (and why it must live off-site)
- Monitor types that catch real failures
- Status pages that build client trust
- Alerting that people actually read
- Turning alerts into automated recovery
- The false-confidence checklist
What Kuma is and what it is not
Uptime Kuma is a Node.js/Vue self-hosted monitor: HTTP(s) checks, TCP, DNS, ICMP ping, push (heartbeat) monitors, domain expiry, and a public status page. Free, MIT-licensed, roughly 40 notification channels.
What it is: an availability and reachability monitor with excellent UX, plus a status page.
What it is not: an APM, a log aggregator, or metrics/observability. It will not tell you that checkout got 40% slower, that a query started scanning a table, or that error rates tripled while HTTP 200 kept returning. For that you want Uptime Kuma plus something like Grafana, Netdata or Prometheus.
That distinction matters commercially: uptime ≠ health. A page that returns 200 with a broken database connection string in the cached HTML is the classic Kuma blind spot.
Installing it properly
mkdir -p /opt/kuma && cd /opt/kuma
cat > docker-compose.yml <<'EOF'
services:
  uptime-kuma:
    image: louislam/uptime-kuma:1
    container_name: uptime-kuma
    volumes: ["./kuma_data:/app/data"]
    ports: ["127.0.0.1:3001:3001"]
    restart: always
    environment:
      PUID: 1000
      PGID: 1000
EOF
docker compose up -d
The rule nobody follows: monitor from outside
Installing Kuma on the same server it monitors is the single biggest mistake in self-hosted monitoring. If that box dies, your monitoring dies with it — silently, with a green dashboard in your memory.
- Run Kuma on a $4–6/month instance at a different provider than what it watches.
- One cheap VPS can monitor a dozen client stacks comfortably.
- For critical services, add a second monitor elsewhere — disagreement between two independent monitors is itself a signal.
A useful pattern: put Kuma on a small box in a different datacentre, expose it behind your own domain (status.yourdomain.com) with Basic-auth or IP allowlist for the admin UI, and keep the public status page on a separate port.
Monitor types that catch real failures
1. HTTP(s) — with the right assertions
Checking status code 200 is weak. Add content conditions:
- Keyword/regex condition: body must contain a string unique to a healthy page — a rendered element, a cache marker, not a generic word.
- Reverse condition: alert if the page contains “Error connecting to database”, “Maintenance mode”, or a stack trace fragment.
- JSON query monitor: for APIs, assert on a specific field, e.g.
status == okordata.length > 0. - Timeout discipline: set the max response time to something meaningful (5–10s), not the default. Slow is down for a user.
/healthz, /api/health — that returns a real dependency check. n8n exposes /healthz; WordPress can via a small mu-plugin.2. Port / TCP — for everything that is not HTTP
Monitor type: TCP
Hostname: mail.example.com    Port: 25    (outbound mail)
Hostname: mail.example.com    Port: 587   (submission)
Hostname: db.internal         Port: 5432  (postgres)
Hostname: redis.internal      Port: 6379  (queue)
If you send email commercially, monitoring port 25 reachability from an external host is not optional. Providers block it silently, and your mail simply queues. This monitor catches it in minutes rather than when a client complains.
3. DNS and domain expiry
- DNS monitor: assert that an A record equals your expected IP. Catches “pointed at the old server after migration” instantly.
- Certificate expiry: alert at 21, 14 and 7 days. Do not rely on auto-renew alone — ACME failures are quiet.
- Domain expiry: the 90-day alert that saves an embarrassing week of downtime.
4. Push / heartbeat — for cron and queues
Push monitors invert the model: the job tells you it ran. Perfect for the failure mode that hurts most — a scheduled task that stops without erroring.
# After every Mautic campaign trigger run:
curl -fsS --retry 3 https://status.example.com/api/push/AbC123dEfGhI \
  ?status=up\&msg=campaigns-ok\&ping=

# After your nightly backup workflow:
curl -fsS https://status.example.com/api/push/XyZ987Backup ?status=up\&msg=backup-verified
If the heartbeat is missed, Kuma alerts. Configure the “expected interval” generously (double your cron cadence) so a slightly late job does not page you at 3am.
The critical monitors in a marketing stack: mautic:campaigns:trigger, mautic:emails:send, mautic:segments:update, n8n backup workflow, and the Postal queue drain. Silent cron death is the #1 reason “my campaign didn’t send” tickets arrive.
Status pages that build client trust
Kuma’s built-in status page is a genuine selling point for freelancers and agencies. Instead of “the site is down, we’re looking into it” emails, you point clients at a public page showing per-service uptime, incident history and response times.
Setup: Manage → Status Page → Add. Publish under a slug, group monitors per service, and set a custom domain via CNAME (status.yourdomain.com).
What makes it credible rather than decorative
- Per-service granularity — “Marketing platform”, “Email delivery”, “Automation”, “Website”, not one giant “All systems operational”.
- Incident templates you fill fast: impact, timeline, mitigation, follow-up ETA. Pre-write a 3-line draft so an update takes 20 seconds, not 10 minutes.
- Maintenance windows in advance — self-hosted stacks need patching; announced maintenance reads as professional, unannounced downtime reads as chaotic.
- Uptime percentages over 7/30/90 days — the number clients ask for. (Set retention so the stats cover the window you advertise.)
Alerting that people actually read
Alert fatigue kills monitoring projects. Two rules:
- Every alert must be actionable. If nobody can do anything about it, it is a dashboard metric, not an alert.
- Escalate by severity, notify by channel.
A routing scheme that works
| Severity | Trigger | Channel |
|---|---|---|
| P1 — down | Primary HTTP or mail port failing 3 checks | Telegram/Signal DM + SMS |
| P2 — degraded | Response time > threshold, one region failing | Telegram group / Slack #ops |
| P3 — warning | Cert <14 days, disk >80%, heartbeat missed once | Slack channel, business hours |
| P4 — info | Recovery, maintenance done | Status page only |
Kuma supports Telegram, Slack, Discord, Signal (via a gateway), webhook, email, Pushover, ntfy, Matrix, Gotify and more. It also supports conditional alert routing per monitor and notification “proxies” for retry/backoff.
Two settings that prevent noise
- Retries before alerting: 2–3. One failed check on a flaky connection should not page anyone.
- Resend interval: set it, and cap it. Getting “still down” every 10 minutes is fine; every minute is how people start muting the bot.
Turning alerts into automated recovery
This is where Kuma stops being a viewer and becomes part of the machine. Kuma fires webhooks on up/down events; n8n can consume them and run the recovery playbook you would otherwise perform manually at midnight.
Realistic recovery ladder
# Kuma monitor down  →  webhook  →  n8n workflow

1. Collect evidence      SSH check: systemctl status, docker ps, last logs
2. Classify              OOM? disk full? container exited? process hung?
3. Safe auto-fix         restart service/container  (max 2 attempts)
4. Re-verify             poll health endpoint 3x over 60s
5. If still down         open incident, page human with the evidence
6. Always                post to status page + log to incident history
Guardrails, non-negotiable: auto-restart only services with a stateless-safe restart; cap attempts per hour; require a signed webhook secret; never auto-act on the database; and make the automation announce itself, or you will forget it exists and be surprised the night it misbehaves.
For a marketing stack, the highest-value automated actions are boring: drain a stuck queue, clear an overfull mail queue, restart a wedged worker, truncate an oversized log, re-trigger a missed cron. All safe. All things that cost a client day if they wait for you to wake up.
The false-confidence checklist
Run this against your current setup. Every “no” is a gap where an outage hides:
- Is monitoring hosted off the box being monitored?
- Do HTTP checks assert on content, not only status code?
- Are reverse conditions set for common error strings?
- Are non-HTTP dependencies (DB, Redis, SMTP:25, SMTP:587) monitored?
- Do all cron jobs and scheduled workflows report a heartbeat?
- Are certificate and domain expiries monitored with 14+ day lead time?
- Does alerting escalate — not just notify one inbox?
- Is there a public status page with per-service grouping?
- Do you test an alert monthly? (Uncertainty: a notification path is untested until it has fired.)
- Is backup restoration — not just creation — verified by monitor?
Want a monitoring layer that actually protects you?
I set up Uptime Kuma on an independent host, add HTTP/TCP/DNS/push monitors for your Mautic, Postal, n8n and WordPress services, configure tiered Telegram/Slack alerts, publish a branded status page — and wire failure alerts straight into n8n so common issues self-heal.
Book monitoring + stack setup →
Want the AI-agent layer too? target=”_blank” rel=”noopener”>OpenClaw agent setup →
Frequently asked questions
Kuma vs Grafana/Prometheus/Zabbix?
Different jobs. Kuma answers “is it reachable and does it look healthy?” in minutes with almost no maintenance. Prometheus/Grafana answer “what is happening inside, and how fast?” — far richer, far more setup. For client stacks I usually ship Kuma first (immediate value, status page included), then metrics when volume justifies it.
Can Kuma monitor behind Cloudflare / a login wall?
Yes, three ways: an unauthenticated health endpoint with real dependency checks (best); HTTP Basic auth fields on the monitor; or custom headers via the “Advanced” options. Avoid cookies/sessions — they expire and the monitor becomes a lie.
Is the database safe in Docker?
Kuma uses SQLite in /app/data. Bind-mount that volume, and stop the container before backing it up (or use sqlite3 .backup) to avoid copying a mid-write database.
What interval should I use?
60 seconds for revenue-critical services, 3–5 minutes for everything else. Kuma can go to 10s but you will pay in noise and DB size. Check from a region near your users.
How many monitors can one small VPS handle?
Comfortably 100–300 on 1 vCPU / 1 GB. Bottleneck is usually memory in the SQLite/Socket.IO layer, not CPU. Split monitors across two instances above that for redundancy anyway.